Mean reversion in trading theorizes that prices tend to return to average levels, and extreme price moves are hard to sustain for extended periods. Traders who partake in mean reversion trading have developed many methods for capitalising on the theory. In all cases, they are betting that an extreme level — whether it be volatility, price, growth, or a technical indicator — will return to the average.
Mean reversion
Mean reversion is a financial theory which suggests that, after an extreme price move, asset prices tend to return back to normal or average levels. Prices routinely oscillate around the mean or average price but tend to return to that same average price over and over.
Mean reversion does not only apply to asset prices. It can be also applied to volatility, earnings, earnings growth rates and technical indicator levels. Read on to discover how to calculate the mean reversion formula and how to apply mean reversion strategies when trading within the financial markets.
What is mean reversion in trading?
Mean reversion formula
To understand and calculate mean reversion, traders need to calculate the mean. The mean is the average price over a given number of data points.
On an asset’s trading chart, the mean is easily represented by a simple moving average (SMA). The SMA calculates the average price in the price series. Over time, prices tend to oscillate around the average or SMA, eventually returning to it.
Trades can use various metrics, such as distance from the SMA, to help to establish when the price could revert back to the mean. Technical indicators such as Bollinger Bands®, regression channels, Keltner channels, and Envelopes each have their own formula and attempt to notify traders when the price is near extreme levels and may revert. However, as always in trading, these can only provide signals and are not a clear indication of reversal.
The following chart shows the Euro 50 stock index oscillating around the 50-week simple moving average over a five-year period. The same concept applies to shorter timeframes.
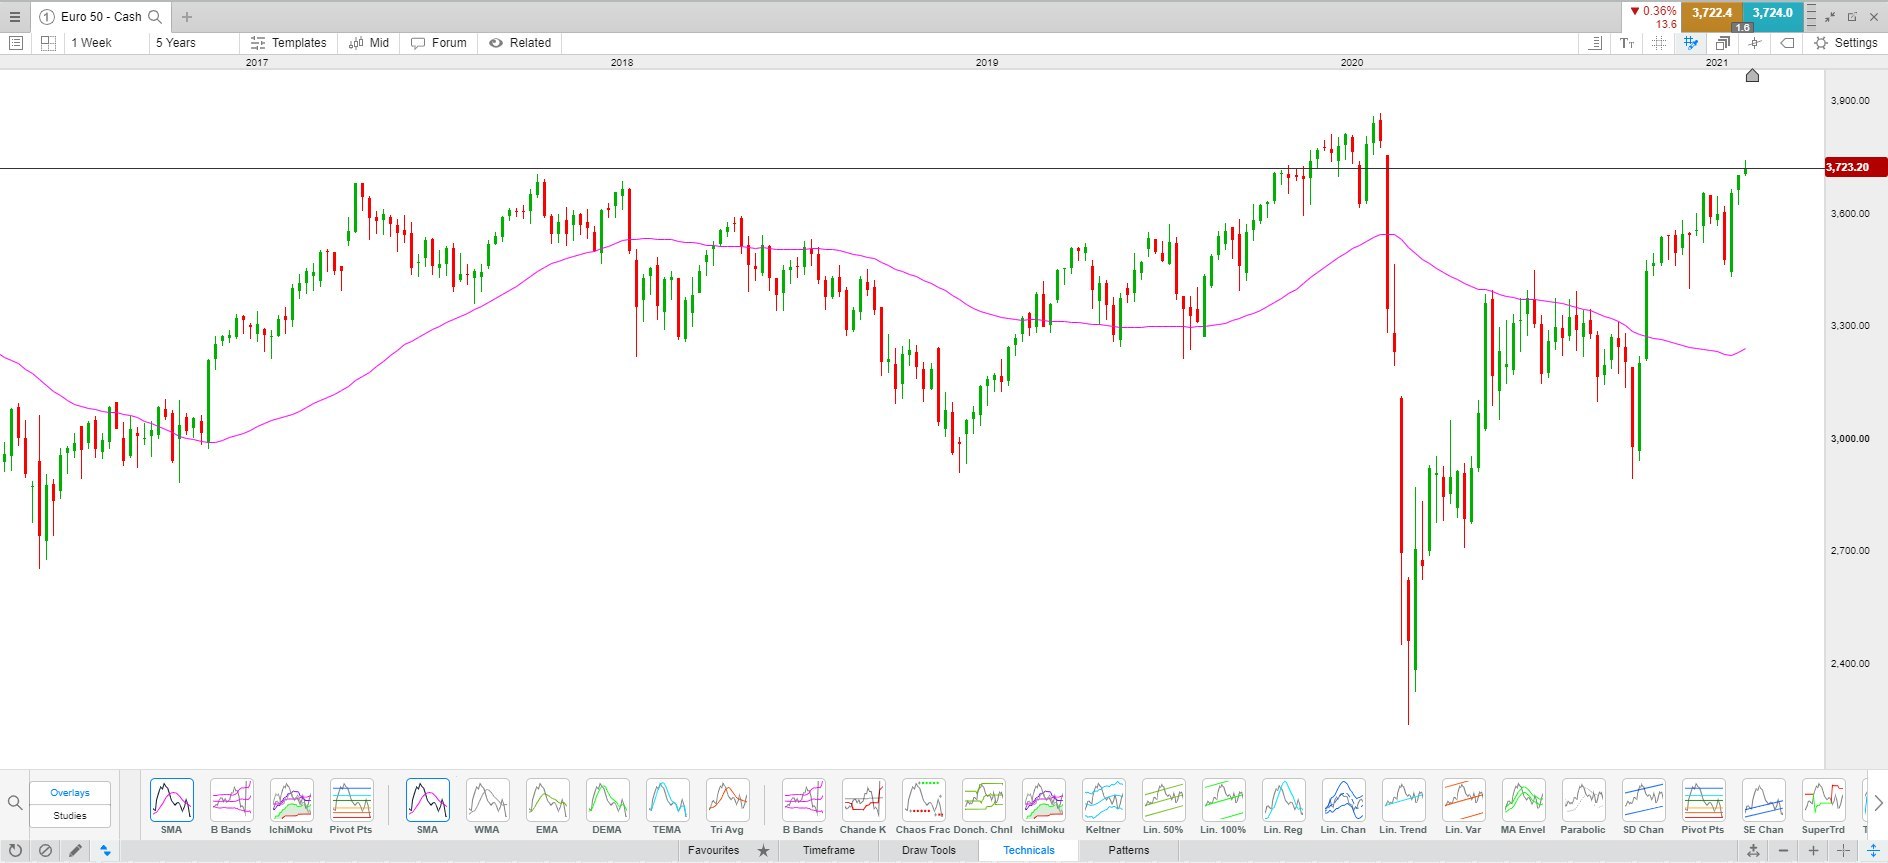
Example of mean reversion
While an instrument’s price tends to revert to the average over time, this does not always mean that the price will drop back to the mean, or that the price will rise to mean. The mean is also moving, so if the price stalls and doesn’t move much, the mean price has time to catch up. That too counts as mean reversion.
The following EUR/USD chart shows a year’s worth of daily candlesticks. At times, the price oscillates around the mean. At other times, the price accelerates away from the mean. The mean (SMA) follows and the two eventually cross paths again.
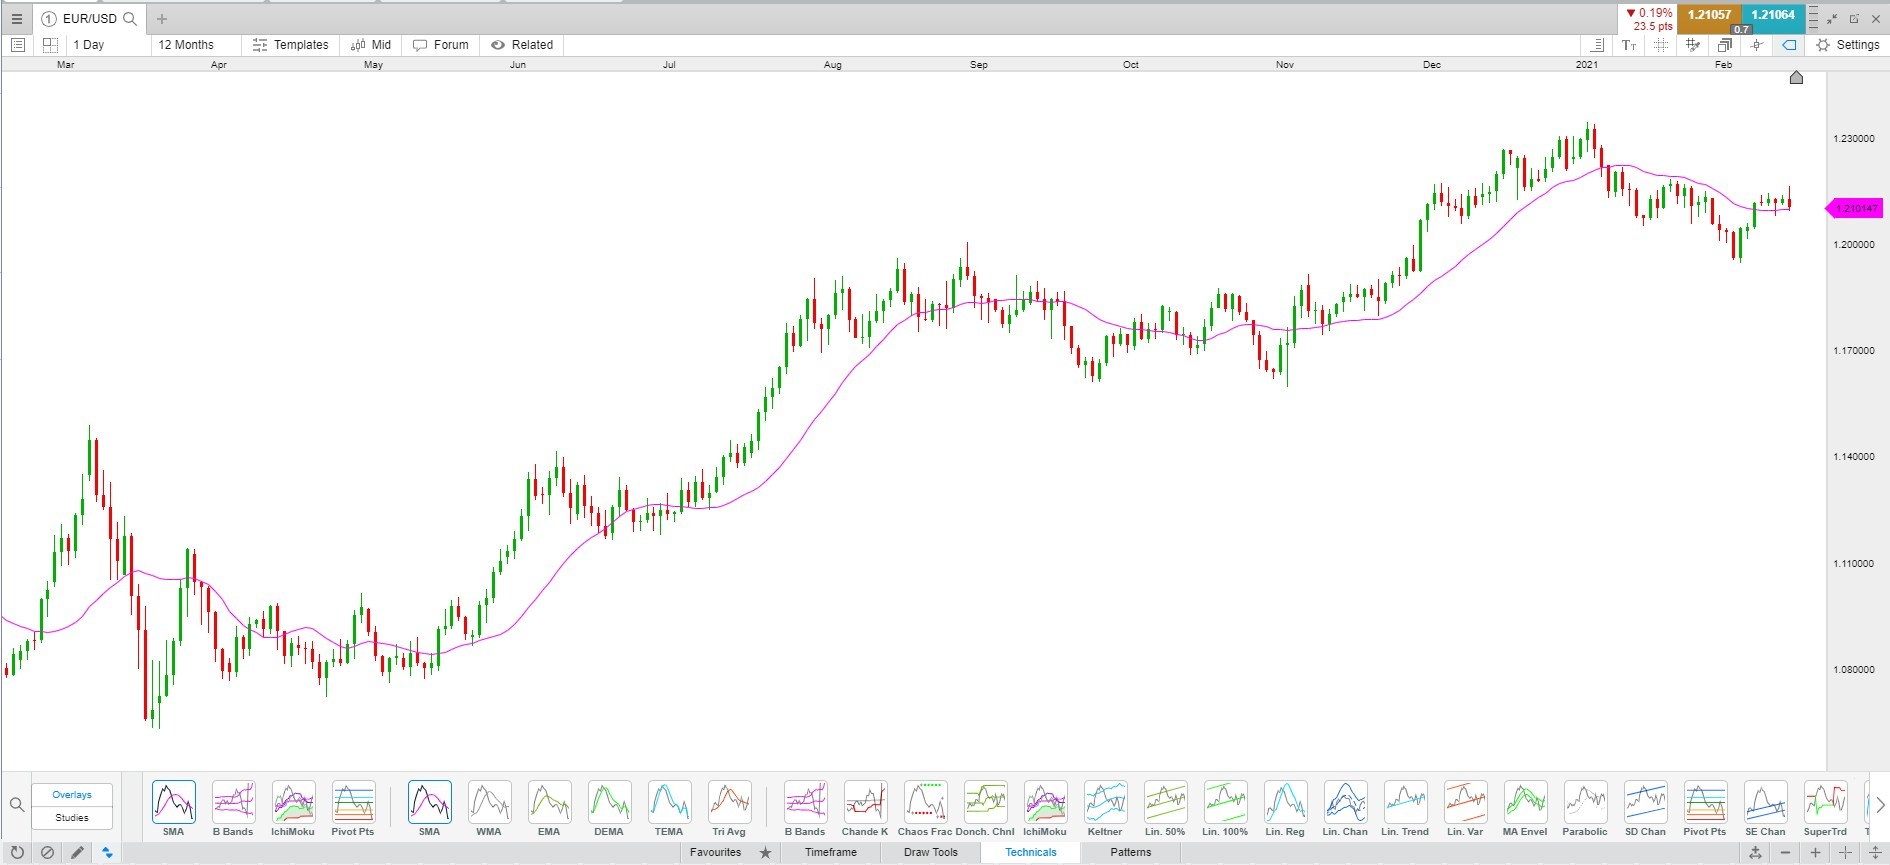
Other indicators such as Bollinger Bands® use standard deviation to measure how far away the price is from the mean. The further away standard deviations are from the mean, the more likely the price is to revert to the mean, although that may not happen right away.
Mean reversion strategies
Mean reversion strategies attempt to capture profits as the price of an asset returns to more normal levels, or the average. When considering using a mean reversion strategy in your trading, remember that a price rising away from the mean doesn’t necessarily indicate that the price will fall. The mean could also simply move up to meet the price. That would also constitute reversion to the mean because the price is back in line with its average. While reversion to the mean occurs regularly, prices rarely stay exactly at the mean for long. Below are some popular examples of mean reversion strategies.
Mean reversion in pairs trading
Pairs trading involves finding two highly correlated assets. The prices of these assets tend to move together. When the prices deviate from one another; for example, one drops when the other doesn’t; this creates a potential mean reversion trade. This is also sometimes referred to as statistical arbitrage.
For example, the EUR/USD and GBP/USD often move in the same direction. Yet on the far right of the below EUR/USD chart, the GBP/USD is rising (red line) while the EUR/USD (candles) is falling. If history is any indication, then those who pairs should eventually start moving in the same direction again.
A trader could potentially buy the underperforming pair and short the stronger pair. This creates the opportunity to profit if the pairs start to align again. A pairs trade requires buying and selling at the same time. It does not matter to a pairs trader which asset rises or falls; they are simply betting that the two prices will converge back to each other and start moving in alignment again.
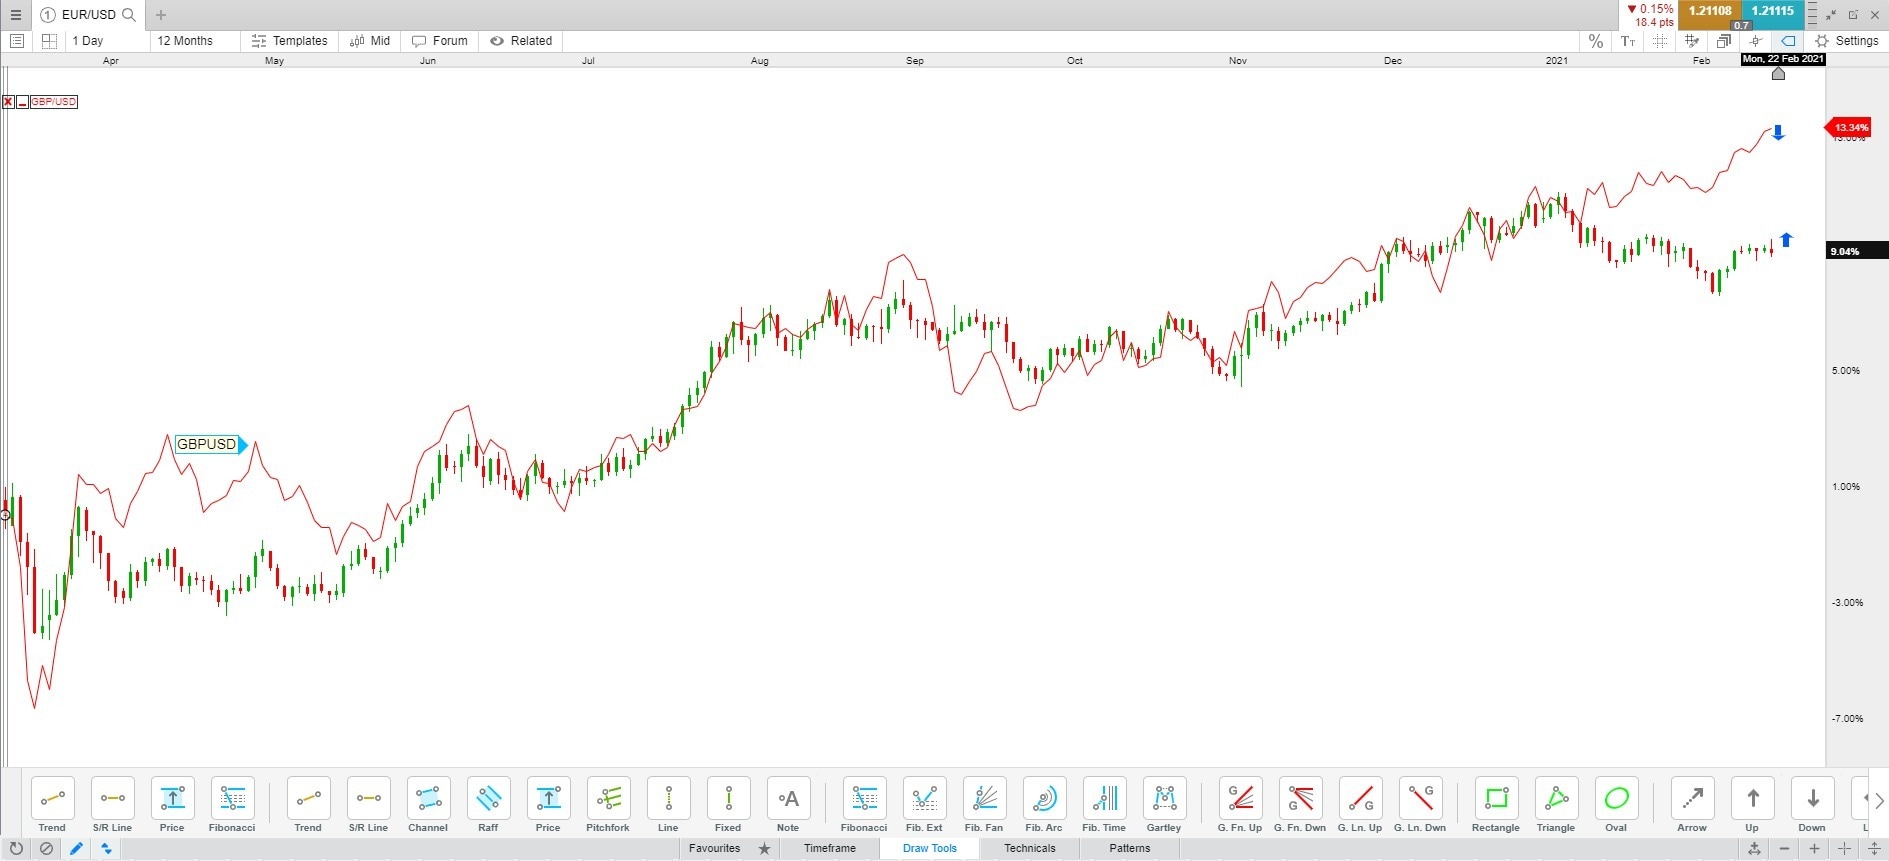
Since it is possible that the two assets may not move in unison again, a stop-loss can be used to control the potential loss on each trade. The profit potential if the assets move back toward each other should be more than enough to offset transaction costs, otherwise the trade may be ignored. Tiny divergences between correlated assets are often not considered to be worth trading.
Since a pairs trade involves buying one asset and selling another, you could consider the hedge ratio, which is determined by how much one asset moves relative to the other. If one asset moves 1% per day and the other asset moves 2% per day, the position in the 2% asset should be half of the 1% asset. This is because if an asset moves more, we don’t need as much of that position to make a profit when compared to an asset that is moving less.
Intraday mean reversion trading strategy
Intraday strategies involve buying and selling multiple assets throughout a single day and positions are most often not held overnight. With day trading, some traders opt to take trades around a moving average.
If there is an uptrend, the price tends to move up from the average and then fall back to it. When the price comes back to the average, this may present a buying opportunity. If there is a downtrend, then the price tends to fall below the average and then rally back to it. When the price is near to the average, this may present an opportunity to take a short position (sell) instead.
The following is a one-minute chart of the Big Tech share basket, which is an exclusive offering on our platform. While not all movements around the moving are forecastable, many traders could use the average to identify trades in the trending direction.
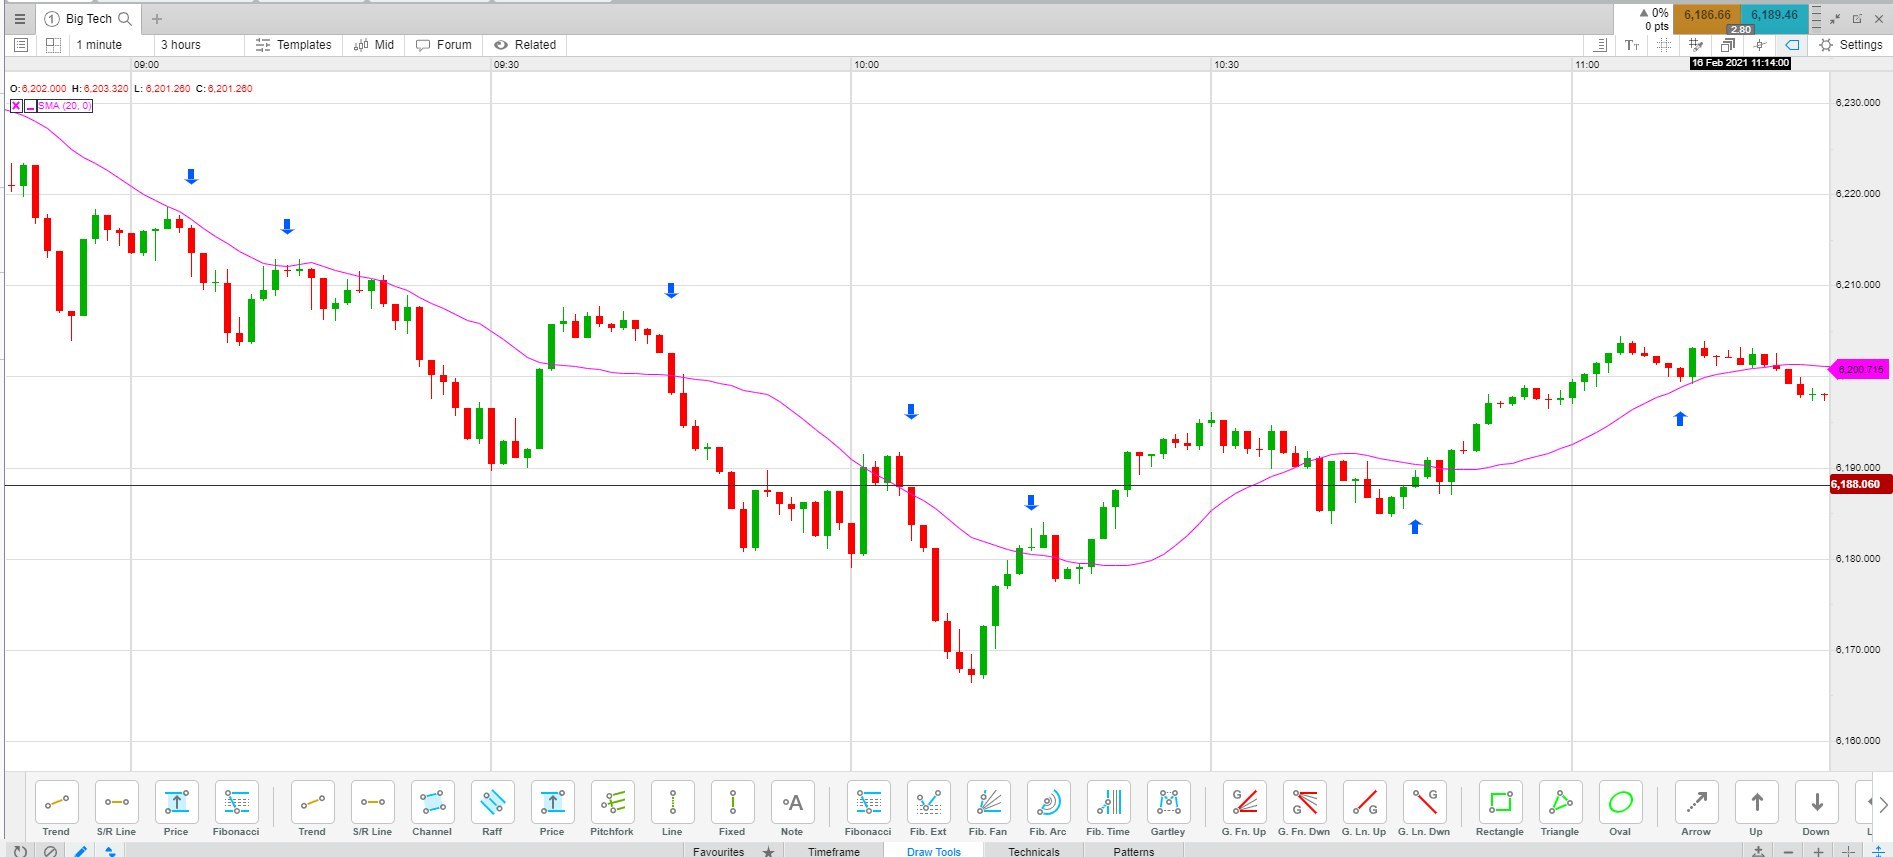
An intraday mean reversion strategy works best when a strong trend is present, combined with a moving average where the price tends to get near it and then moves in the trending direction. It does not work as well when a strong trend is not present. Trading in the same direction as a strong trend is often referred to as a momentum trading; so read more information about this type of strategy.
Mean reversion forex strategy
One strategy that traders may consider for forex trading is looking at how far the price tends to deviate from the mean before reverting back to the mean. This can be done on our Next Generation advanced trading platform by using a moving average convergence divergence (MACD) or Percentage Price Oscillator (PPO), then setting the Fast Length to 1 and the Slow Length to how many periods you would like averaged.
On the EUR/USD chart below, the PPO is used to show how the closing price (1 period) compares to the 21-day average price. The black trendlines mark common areas where the price reverted back toward the mean. There are notable exceptions where there were large price moves, and these also tended to reverse near similar levels on the PPO.
So, how could a strategy like this be used? Some traders may opt to enter a short position if the price rises above a common reversal level on the PPO, then drops below that level. A target could be placed at the mean (moving average, or 0 level, on indicator).
The profit target (the average) is constantly moving, so traders may opt to update it with the completion of every price bar. To manage risk, a stop-loss has been placed just above the recent swing high that occurred prior to entry. This helps to control the loss in the event that the price continues higher instead of going back to the mean.
The same concept applies to long trades when the price dips below the common reversal point on the PPO and then rallies back above that level. The horizontal line (reversal point) on the PPO or MACD will vary by asset, and traders may wish to place it at a spot where many reversals have occurred.
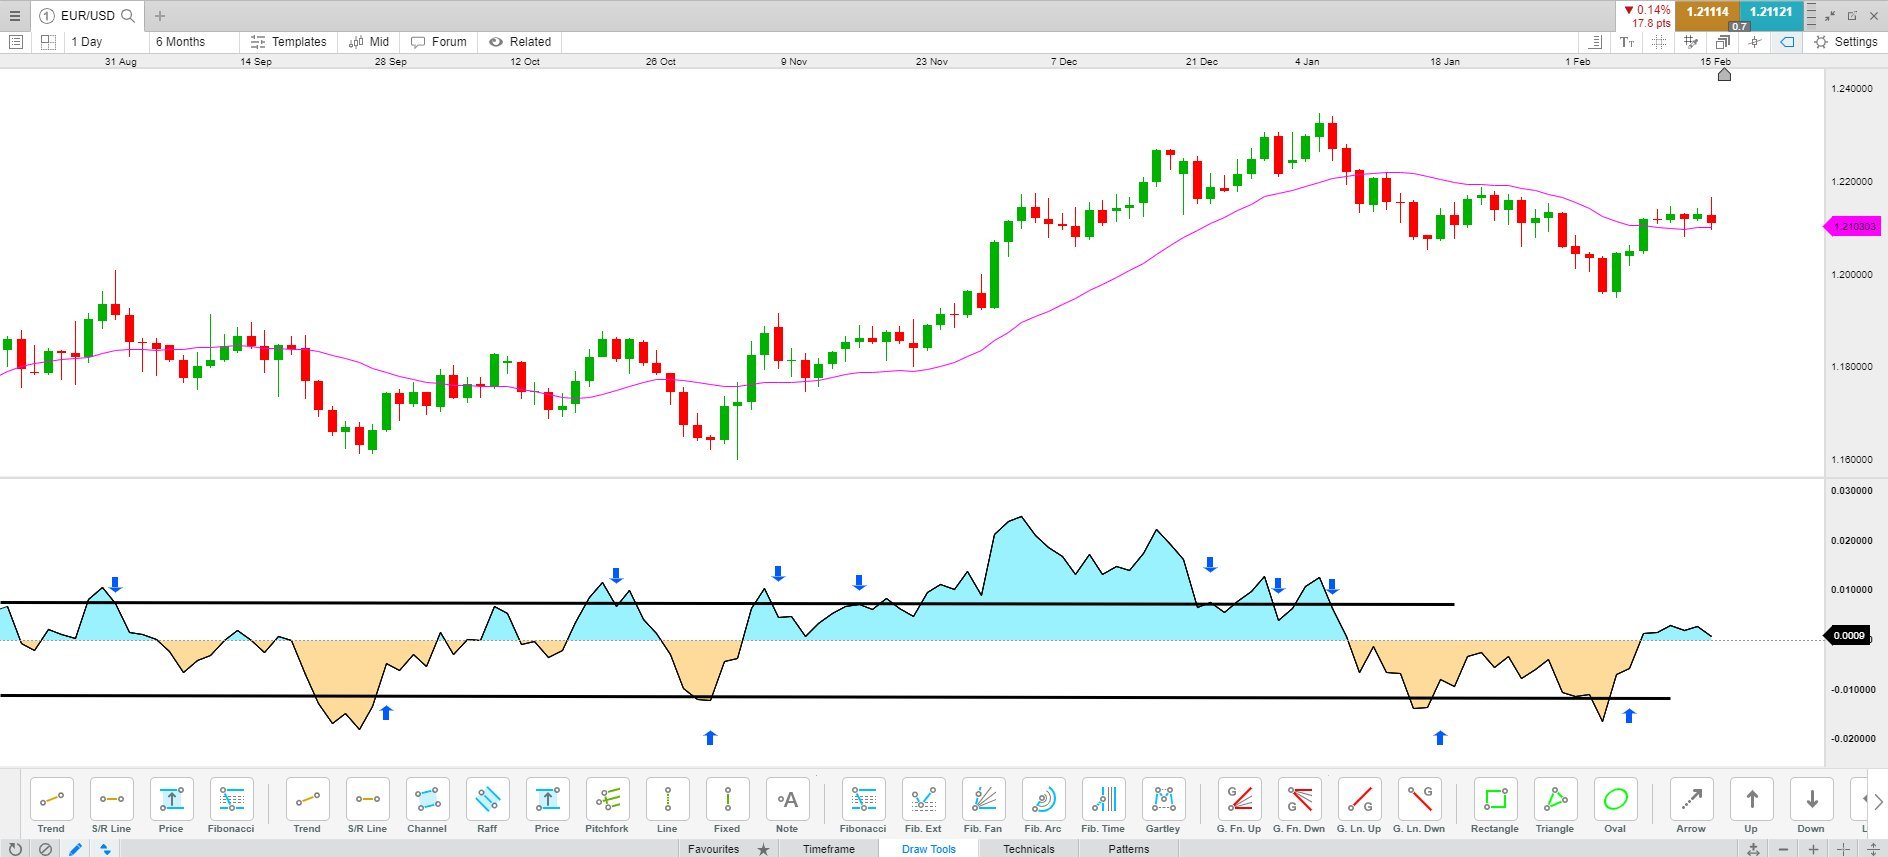
A mean reversion strategy like this assumes that the price will continue to move as it has in the past. However, this won’t always be the case. Price moves may get bigger or smaller, while still reverting to the mean over time. Because changes in the magnitude of price moves occur, a stop-loss order helps to control losses when the price doesn’t do what history indicates that it might.
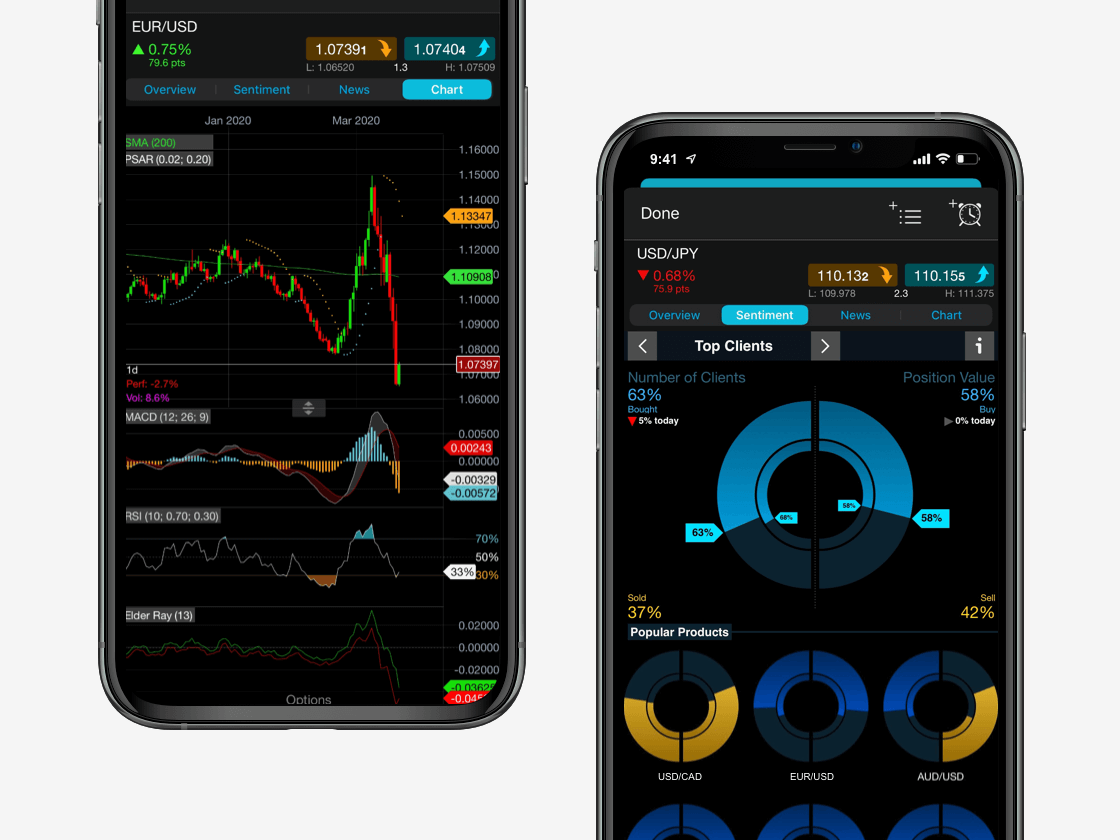
Seamlessly open and close trades, track your progress and set up alerts
Mean reversion and regression
A regression line shows a single line that best fits a selected price series. The price tends to oscillate around the regression line. The Raff (regression) tool on our trading platform can be used to plot this line for traders. Traders can select the tool, then select the first point in time and connect the tool to another point in time.
A Raff regression is shown below on a Crude Oil Brent 4-hour chart. The regression (middle) line highlights the dominant trend and the price tends to move around it. This may continue into the future. The upper and lower lines mark the furthest points that the price has moved from the regression line. These could indicate extreme price levels, where the price could reverse back toward the middle regression line.
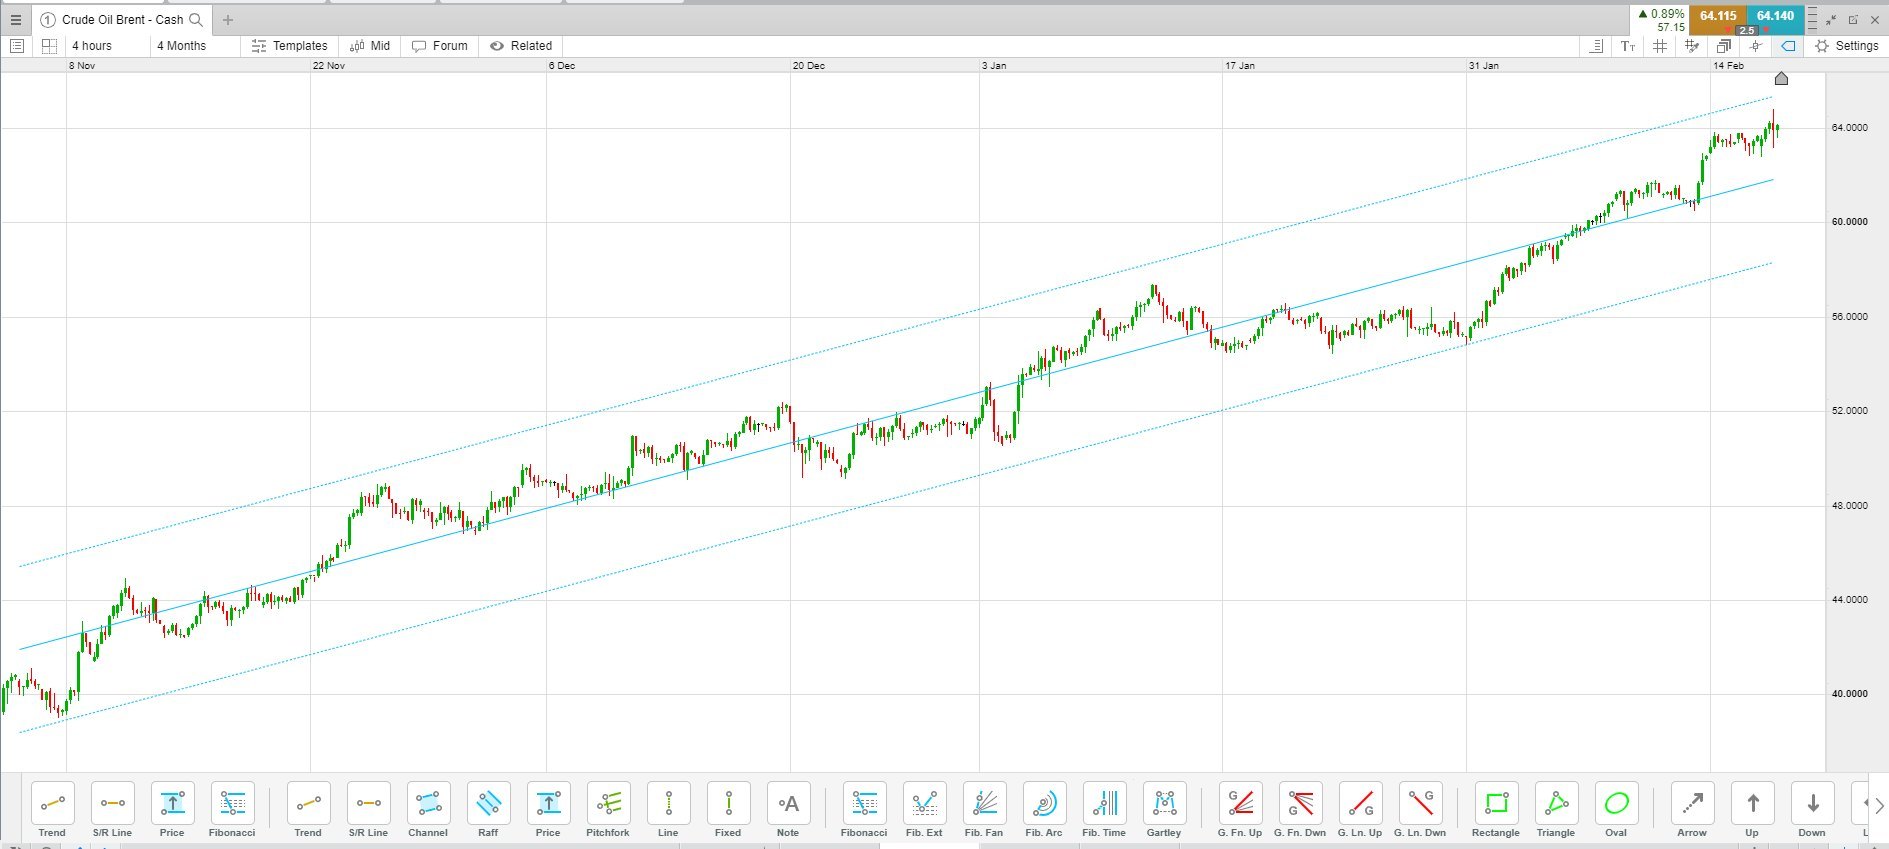
A regression is simply another way of measuring what normal looks like. The chart above shows that the price tends to return to “normal” levels, which in this case is the regression line. Read more about our charting features, which include a wide range of technical indicators and drawing tools.
Mean reversion trading system
A mean reversion trading system requires a trading platform with mean reversion tools, such as regression lines, moving averages, MACD or PPO indicators, and the ability to compare assets for pairs trading.
For example, to carry out a pairs trade, select one of the instruments from the pair that you are interested in. Select this product from the Product Library to open a trading chart. Next, in the Product Library, search for the other asset in the pair that you want to trade. Drag the name of that asset on to the existing chart. On the chart below, we have dragged West Texas Crude Oil on to the existing Brent Crude Oil chart to compare the two types of oil and look for potential divergence and a possible reversion to the mean trade.
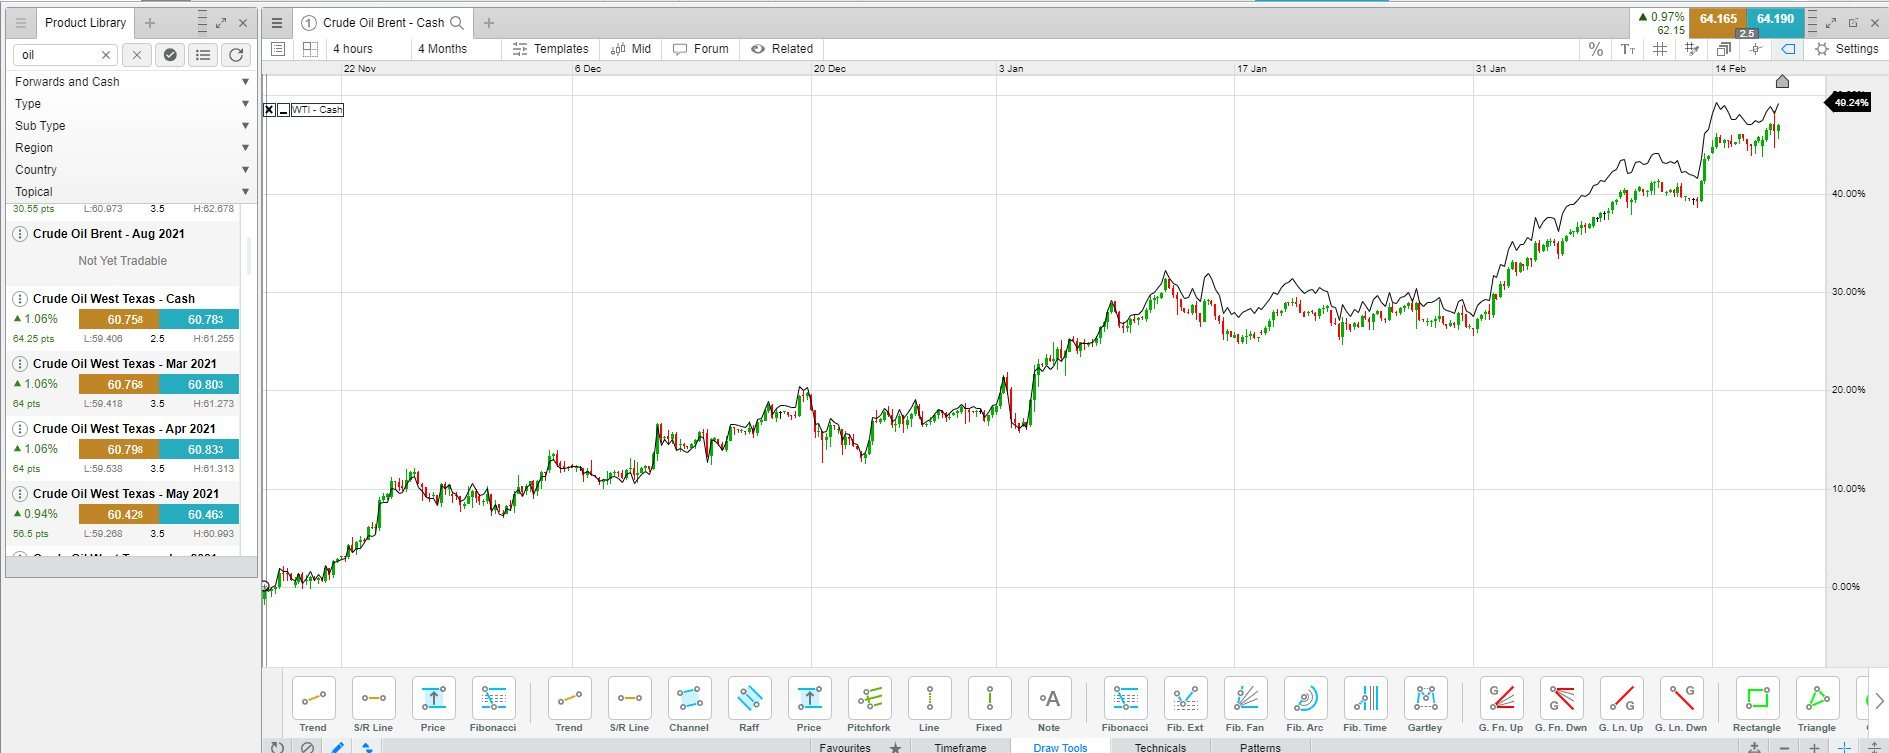
Both assets now appear on the same chart. Traders can assess how they will enter and exit each trade and select the buy or sell buttons in the upper left corner accordingly. It is also possible to apply stop-losses and target to the order tickets.
- Open a live account to start trading via spread bets and CFDs and deposit funds.
- Open a demo account to practise your mean reversion strategies with virtual funds.
Mean reversion indicator on MT4
For more complex algorithmic trading strategies using mean reversion, we also offer trading on the MetaTrader 4 platform (MT4). MT4 allows traders to program their own methods into automated software called Expert Advisors (EAs). Traders can also use the EAs created by others, which can be downloaded from the Market or Code Base tab inside MT4. To learn more, register for an MT4 account.
Summary
Mean reversion is a useful market concept to understand, but it doesn’t assure profitable trading. While prices do tend to revert to the mean over time, we can’t know for sure, in advance, when that will happen. Prices can continue moving away from the mean for longer than expected. Also, trend direction may change, or how much or how little the price moves may change. Just because a price has risen doesn’t mean it will fall to the mean; the mean could also rise to meet the price.
Because of these unknowns, most professional traders have strict risk-management protocols. They can define an exit point where their position will close out if the price doesn’t move in their expected direction, helping to minimise losses as much as possible.
